Leads three times cheaper. Revenue up 4.6×.
A Google lead cost $90 before Point Higher and about $30 after. The bigger money sat between the inquiry and the call: 3.5 minutes to answer instead of three hours. In the same two states, annual revenue went from $2.10M to about $9.7M. The client is not named here, and the brand marks in these screenshots are a stand-in: the work, the numbers and the layouts are the real ones.
- Client
- Under NDA
- Industry
- Moving & relocation
- Market
- 2 → 12 states
- Scope
- Growth strategy · performance · SEO · CRO · sales
- Timeline
- 36 months, from March 2023
- Website
- Not shown — NDA
- annual revenue in the original two states — 4.6× on the same map
- $2.10M → $9.7M
- median time to answer an inquiry; the SLA is five minutes
- 3 h → 3.5 min
- average Google Ads lead — three times cheaper than before
- $90 → $30
- annual revenue across the whole map, 12 states by year three
- $14.67M
Marketing ran on a freelancer who vanished for weeks.
The owner ran every process himself and had stopped coping. Advertising sat with a remote specialist who went quiet for weeks at a time. What the business needed was not a tidier ad account — it was a marketing team.
We split the responsibility in writing. Point Higher runs the marketing system: strategy, analytics, acquisition, CRO and the integration with sales. The client runs operational capacity and decides which states to open next.
“The first month we barely touched the ad accounts. First we had to find where the money was leaking. It turned out not to be only Google — it was the three hours between an inquiry and the first call.” — Valerii Fedorov, CEO, Point Higher
What March 2023 actually looked like
Annual revenue of $2,104,980 across two states, ten trucks, and demand resting on two sources.
- Problem 01
Annual revenue $2,104,980 — two states, ten trucks. The starting month did $120K; the weakest month of that year did $69K.
- Problem 02
Demand came from two sources only: Google Ads and Yelp.
- Problem 03
A Google lead cost $90 on average, and the cost per order was around $333.
- Problem 04
The median answer to a website inquiry was three hours.
- Problem 05
Calls were neither recorded nor transcribed, so nobody could see where deals were lost.
- Problem 06
There were no shared scripts and no transparent sales KPIs.
Three jobs, one accountable team
Strategy and analytics
Diagnose the channels, the website and the losses between an inquiry and a sale — before touching budgets.
Acquisition and CRO
Google, Bing, Yelp, SEO, Reddit, landing pages, and three full versions of the website.
Sales and demand retention
Telephony, response speed, scripts, KPIs, training, referrals and partnerships.
4.6× in the same two states. New states came on top.
In the base market, annual revenue went from $2.10M to about $9.7M — roughly $7.6M more per year on the same map. Across all twelve states, year three closed at $14,674,800, and about two thirds of it still comes from the original two.
| Before the project, 2 states | $2.10M |
|---|---|
| Year 3, the same 2 states | $9.7M |
| Year 3, all 12 states | $14.67M |
Every annual figure is an actual twelve-month result, not a forecast or a run-rate. Base-market growth counts the original two states only; revenue from new states is shown separately and is not part of the 4.6×. The first year ran in the two original states; Pennsylvania and Vermont opened in March 2024, then roughly one state every two to three months.
A cheap lead is worthless if you call back three hours later.
In the first six months we rebuilt the sales side as part of marketing: telephony with call recording and transcription, an SLA of five minutes on every form, scripts and a new sales structure, retrained staff with KPIs and bonuses, and an internal reward store for the crew. The median answer went from three hours to 3.5 minutes.
The research backs the urgency: companies that tried to contact a lead within an hour were nearly 7× more likely to reach a decision-maker than those who waited one hour longer, and more than 60× more likely than those who waited a day (Oldroyd, McElheran & Elkington, *The Short Life of Online Sales Leads*, Harvard Business Review, 2011).
“We cut the cost of a lead by two thirds, but that was not the main win. The main win was the manager calling back before the customer found another company.” — Valerii Fedorov, CEO, Point Higher
What one month looks like, start and record
An order is a confirmed move with a deposit paid. The record month is the strongest month of year three, across all twelve states.
| Per Month | At the Start | Record Month |
|---|---|---|
| Inquiries | ≈737 | 4,175 |
| Orders | 199 | ≈1,822 |
| Inquiry to order | 27% | 43.6% |
| Average ticket | ≈$603 | ≈$849 |
| Revenue | $120K | $1,546,000 |
Average ticket is calculated: the month's revenue divided by its number of orders. Out of the Google Ads flow, 25–35% of leads become inquiries and 45–50% of those become paid orders.
Where the money went, month one to month 36
A Google lead fell from $90 to about $30, and an order from Google from about $333 to about $195 — 41% cheaper.
| Line Item, per Month | At the Start | Final |
|---|---|---|
| Google Ads | $10K | $95K |
| Yelp | $10K | $44K |
| Other channels | — | $14K |
| Point Higher team | — | $36K |
| Total | $20K media only | $189K including the agency |
At the start only the media budget was known. The final $189K includes our work and is 12.2% of the record month's revenue ($1,546,000). Over 36 months, $3.676M went into marketing. Counting the original two states alone, the $7.6M of annual growth is $2.07 back on every $1, even if the entire budget is charged to that market; across the whole map, $12.57M of growth is $3.42 on every $1, part of which came from the expansion the client decided on. These are revenue figures, not profit. Blended CAC in the record month was about $104.
What each channel was actually for
- 01
Google Ads
About $30 a lead, down from $90, and about $195 an order, down from $333. Budget grew from $10K to $95K a month.
- 02
Bing
$22 a lead, up to 100 leads a month, with an average ticket 2.5× higher than Google's. Volume is capped by how few people search there.
- 03
Yelp
Scaled to $44K a month, but the business no longer depends on it the way it did at the start.
- 04
Facebook and Thumbtack
Both were tested and switched off: neither reached a workable cost per order, and we don't hold budget for presence.
Not everything that fails to sell should be switched off
Reddit
60–70 leads a month — but only after six-plus months of steady work with nothing to show.
SEO
Local pages and content built a durable stream of relevant organic traffic. Absolute volume stays with the client.
Partnerships and referrals
A partner track and client gifts turned recommendations into a demand source of their own.
Instagram
Almost no direct sales. Its job is to let a customer check the company before calling — the team, the real process, the reviews.
Brand book
One visual and verbal system across the site, ads, social, partner materials, crew uniforms and client gifts.
The team: 3 → 8
The people on the account grew from three to eight: performance, SEO and content, reputation, partnerships, analytics and CRO.
Winter no longer zeroes the year.
In year three, November to March held between $260K and $404K a month in the original two states, with a median of $345K. The weakest winter month of year three was 3.8× the weakest month before the project — on the same map.
| Before the project, weakest month | $69K |
|---|---|
| Year 3, Nov–Mar, median, same 2 states | $345K |
| Year 3 winter, best month, all 12 states | $579K |
What carried the off-season: new channels widened demand in the months when Google and Yelp dip, answering in 3.5 minutes stopped the loss of expensive winter inquiries, and SEO, Reddit, partners and referrals compounded on their own, independent of bid prices.
Thirty-six months, in order
- March 2023
Diagnosis
Google Ads, Yelp, the website, telephony — and the losses between an inquiry and a sale.
- Months 1–6
A new sales system
Call recording and transcription, scripts, KPIs, training, bonuses and a five-minute response SLA.
- After Month 6
Scaling the channels
Bing, SEO, partnerships, referrals, Reddit and new versions of the site; Facebook and Thumbtack tested.
- Years 2–3
Opening new states
Pennsylvania and Vermont in year two, then roughly one state every two to three months.
- Month 36
A system
$1.55M in the record month, twelve states, and a dedicated Point Higher team of eight.
Facebook, Thumbtack and six silent months on Reddit
A growth system is not a list of good decisions. It is how fast you switch off what doesn't work and keep pushing what works slowly.
Tested, never reached the cost per order we needed, switched off. We don't hold budget for presence.
Tested, the result was poor, closed. We didn't scale something that doesn't pay back.
Over six months of near silence. We kept going — it is now 60–70 leads a month.
Three complete rebuilds, because each version stopped matching the business — new geography, new services, new conversion demands.
Almost no direct sales. We changed its job instead of cutting it — it became the channel where a customer checks you before the call.
The whole engagement in one table
| Metric | At the Start | After 36 Months |
|---|---|---|
| Annual revenue, original 2 states | $2,104,980 | ≈$9.7M · 4.6× |
| Annual revenue, whole map | $2,104,980 (2 states) | $14,674,800 (12 states) |
| Monthly revenue | $120K, starting month | $1,546,000, record month |
| Winter, original 2 states | weakest month $69K | $260–404K · median $345K |
| Cost per order, Google Ads | ≈$333 | ≈$195 · −41% |
| Cost per lead, Google Ads | $90 | ≈$30 · three times cheaper |
| Inquiry to order | 27% | 43.6% |
| Monthly funnel | ≈737 inquiries → 199 orders | 4,175 inquiries → ≈1,822 orders |
| Average ticket (calculated) | ≈$603 | ≈$849 |
| Marketing investment per month | $20K media | $189K with the team · $3.676M over 36 months |
| Median response to an inquiry | 3 hours | 3.5 minutes · SLA ≤5 minutes |
| Map / agency team | 2 states / 3 people | 12 states / 8 people |
What to take from this
Count orders, not leads
The lead got three times cheaper, but the money comes from orders — and their price moved on response speed, scripts and CRO.
Response time is a marketing metric
A lead that goes cold in three hours is spent money, whatever it cost to buy.
A trust channel is not a sales channel
Instagram barely sold anything directly, and it still helped customers decide to call.
Organic needs six months
Reddit and SEO pay back slowly — and they don't get more expensive when bids do.
A website is a process
Three versions in three years is a normal pace for a business that keeps changing its map.
Thirty-six months later, the growth sits between an inquiry and the first call.
Same two states, 4.6× the annual revenue, leads three times cheaper, and a winter that no longer wipes out the year.
- 4.6×
Annual revenue
$2.10M → ≈$9.7M in the original two states
- $14.67M
Annual revenue in year three
actual, across all 12 states
- 3.5 min
Median response
down from three hours, against a five-minute SLA
- $2.07
Back on every $1 invested
conservative: base market only, whole budget charged to it
“Huge thanks: you approached the work responsibly and did considerably more than the contract called for.”
The site became a process, not a project with a deadline.
Three full rebuilds in three years, each one because the business had outgrown the last: new states, new services, new conversion requirements. Pages per service and per market, a short path to a price, reviews and video that explain the process, and landing pages tied to the campaigns that feed them.
The rest of this case is the current version — what it looks like, how it is built and what it does for the crew behind it.
Moving is won on trust and a fast quote.
This company earned its name the hard way — thousands of moves and a 4.9★ record across Google, Yelp and Angi, run by a crew people trust with everything they own in the back of a truck. In a market crowded with lowball quotes and no-shows, customers choose on two things: how fast they can get a real price, and how much they believe you’ll actually show up.
The job was a website that wins on both — and does it before a competitor’s form even loads.
A site that made trusted movers look ordinary.
The old site looked like every other moving company — and let a great reputation go to waste. Three problems, each one costing booked jobs:
- 01
The quote was a phone call away — not on the page, where the decision actually happens.
- 02
Coverage was a mystery — no clear picture of how far the crews actually go, from the block to the coast.
- 03
The 4.9★ record was buried — the reviews that calm a nervous mover, out of sight.
A senior-only team — the people who scoped it are the people who shipped it.
- Founder · Strategy

Valerii Fedorov
Set the direction — quote-first, trust-first — and reviewed every release.
- Web & Engineering

Nick Fedorov
Built the platform — Next.js, the instant-quote flow and a headless CMS the team runs itself.
- SEO · Technical

Alex Yaremenko
Local and service-area SEO, schema and Core Web Vitals — ranking in every town the crews serve.
- COO · Delivery

Veronika Bloemhof
Ran delivery — scope, sprints and the promises we kept along the way.
- senior operators
- 4
- brief to launch
- 8 wk
- two-week sprints
- 4
- juniors on the build
- 0
Put the quote in the hero. Map the coverage. Show the proof up front.
- 01
Quote-first
A real, all-inclusive estimate starts in the hero — before anyone reaches for the phone.
- 02
Coverage, clear
Every town the crews cover, at a glance — from the block to the coast, on a live map.
- 03
Proof up front
The 4.9★ record and real crews — shown immediately, not hidden.
Bold, orange, unmistakable — and fast.
One platform, four moves: a quote that starts in the hero, services that read at a glance, coverage on a live map, and trust shown on arrival.
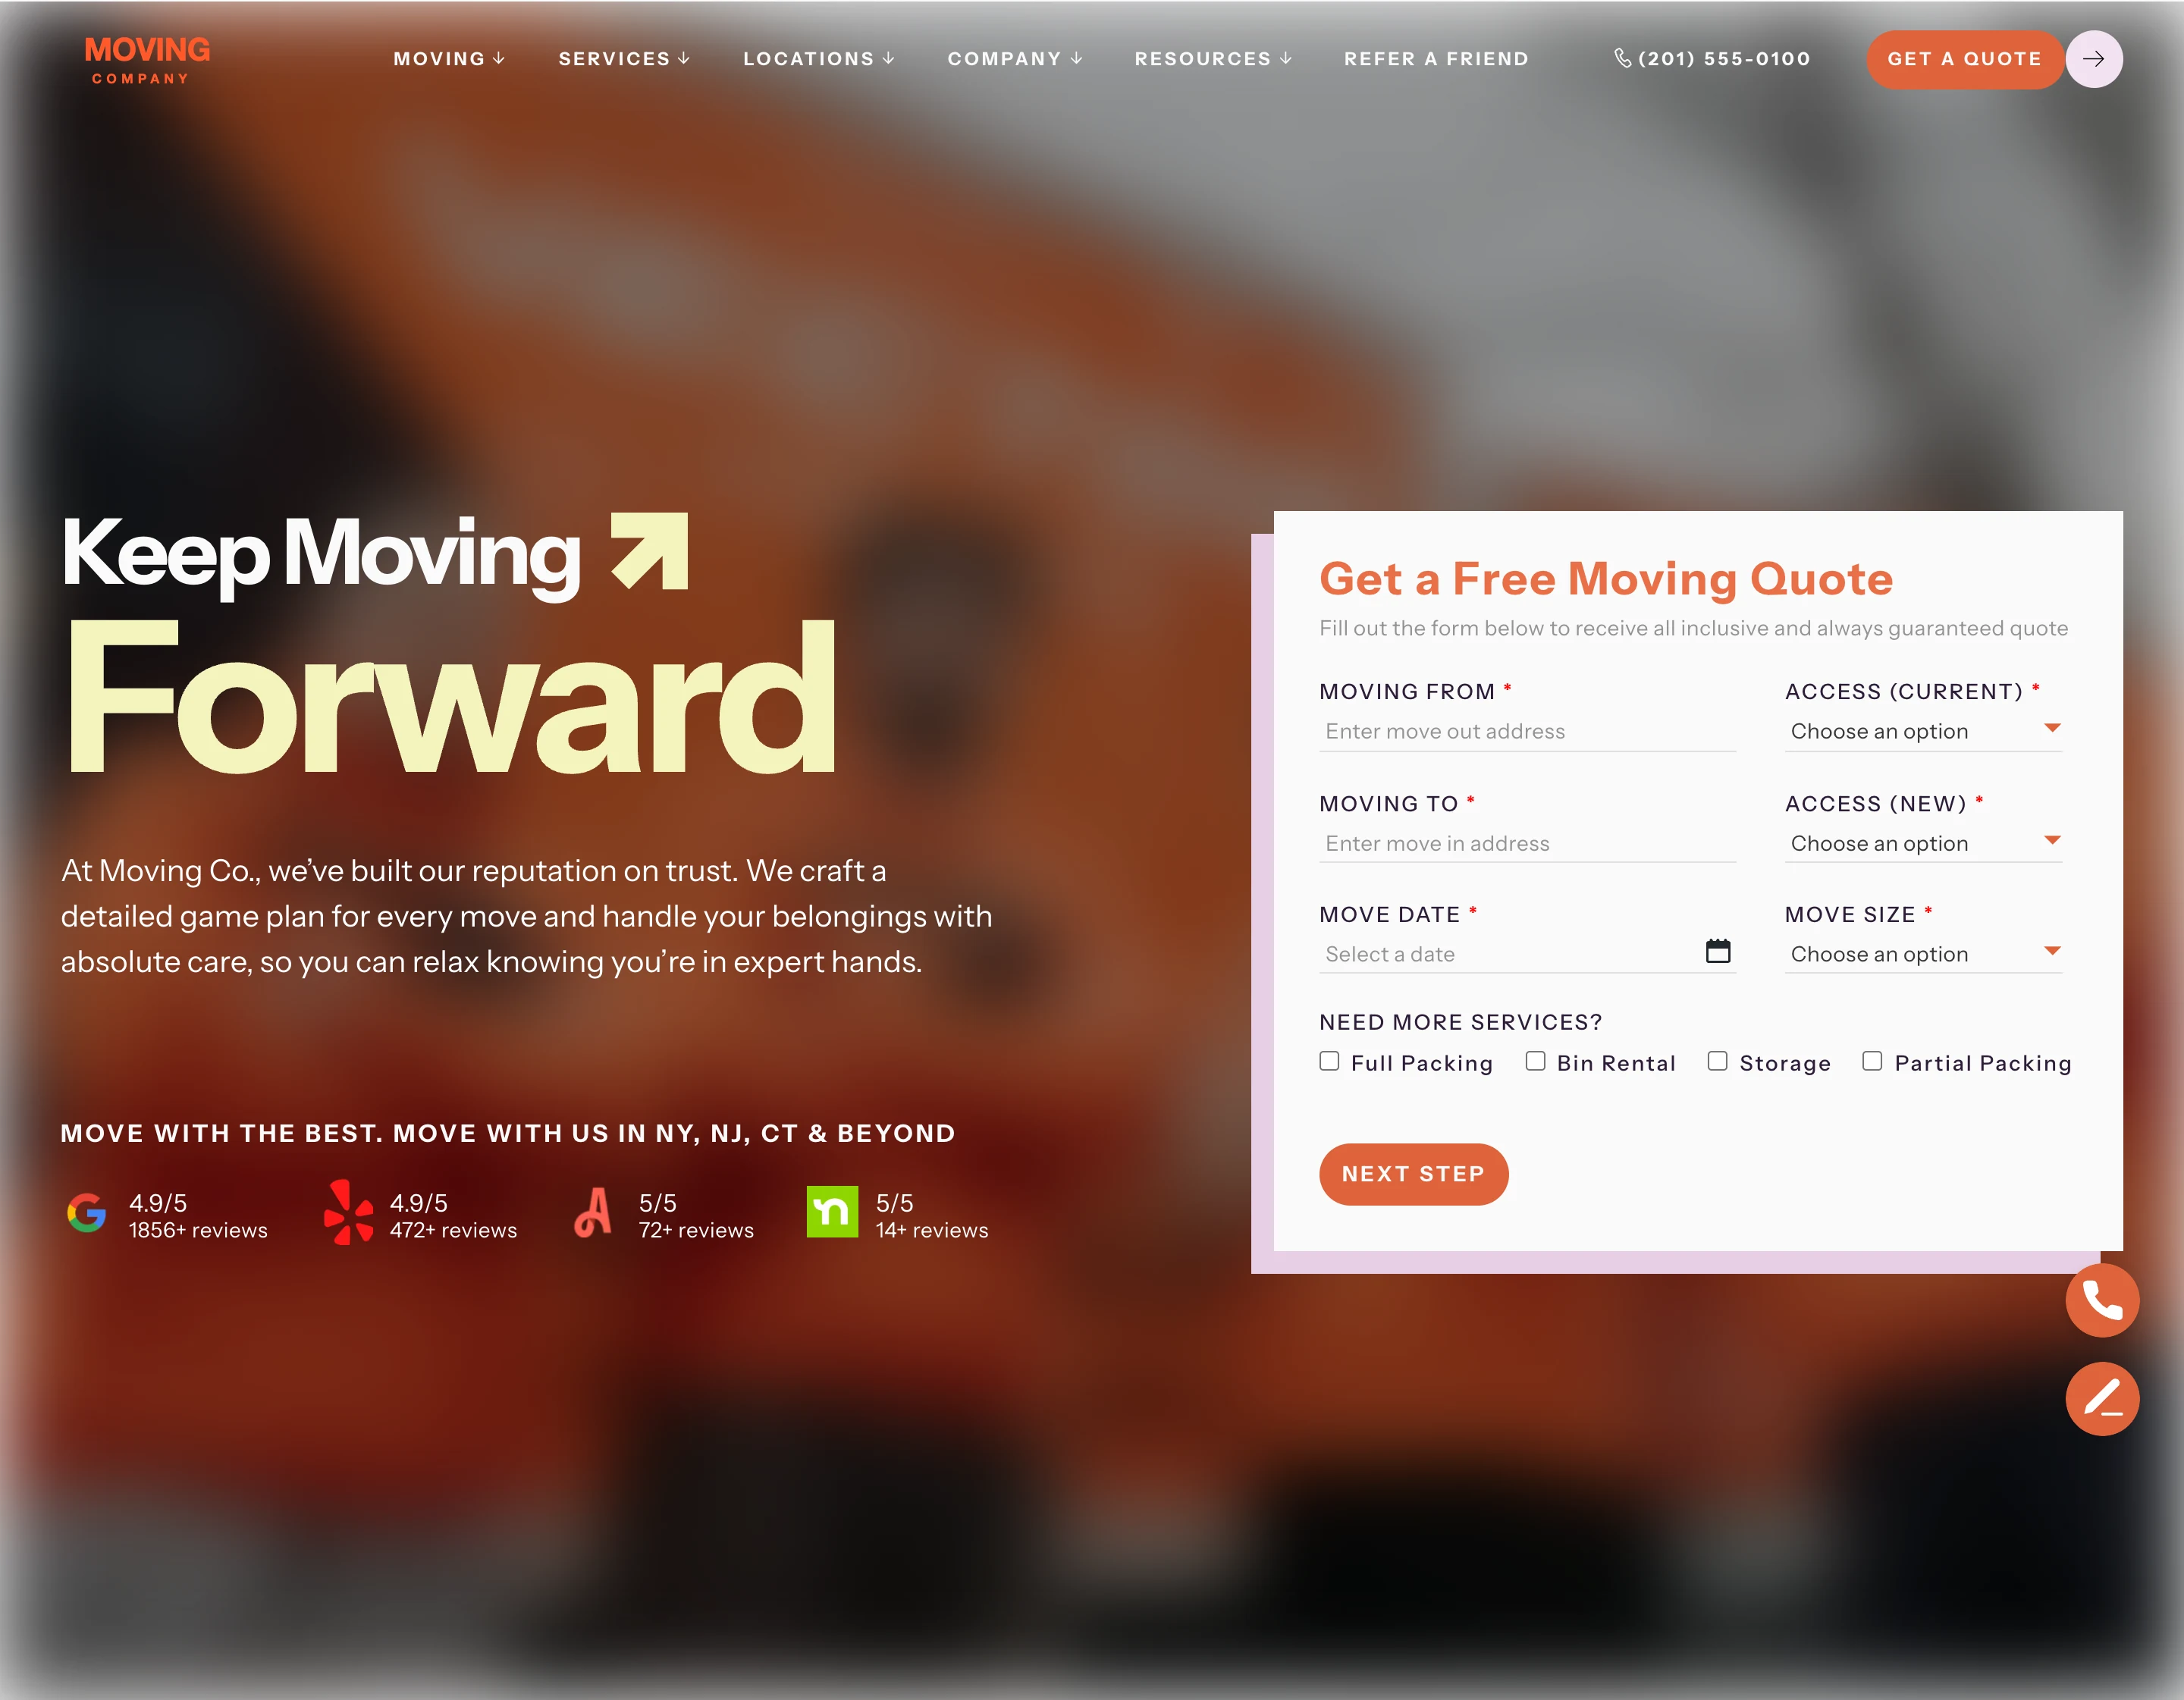
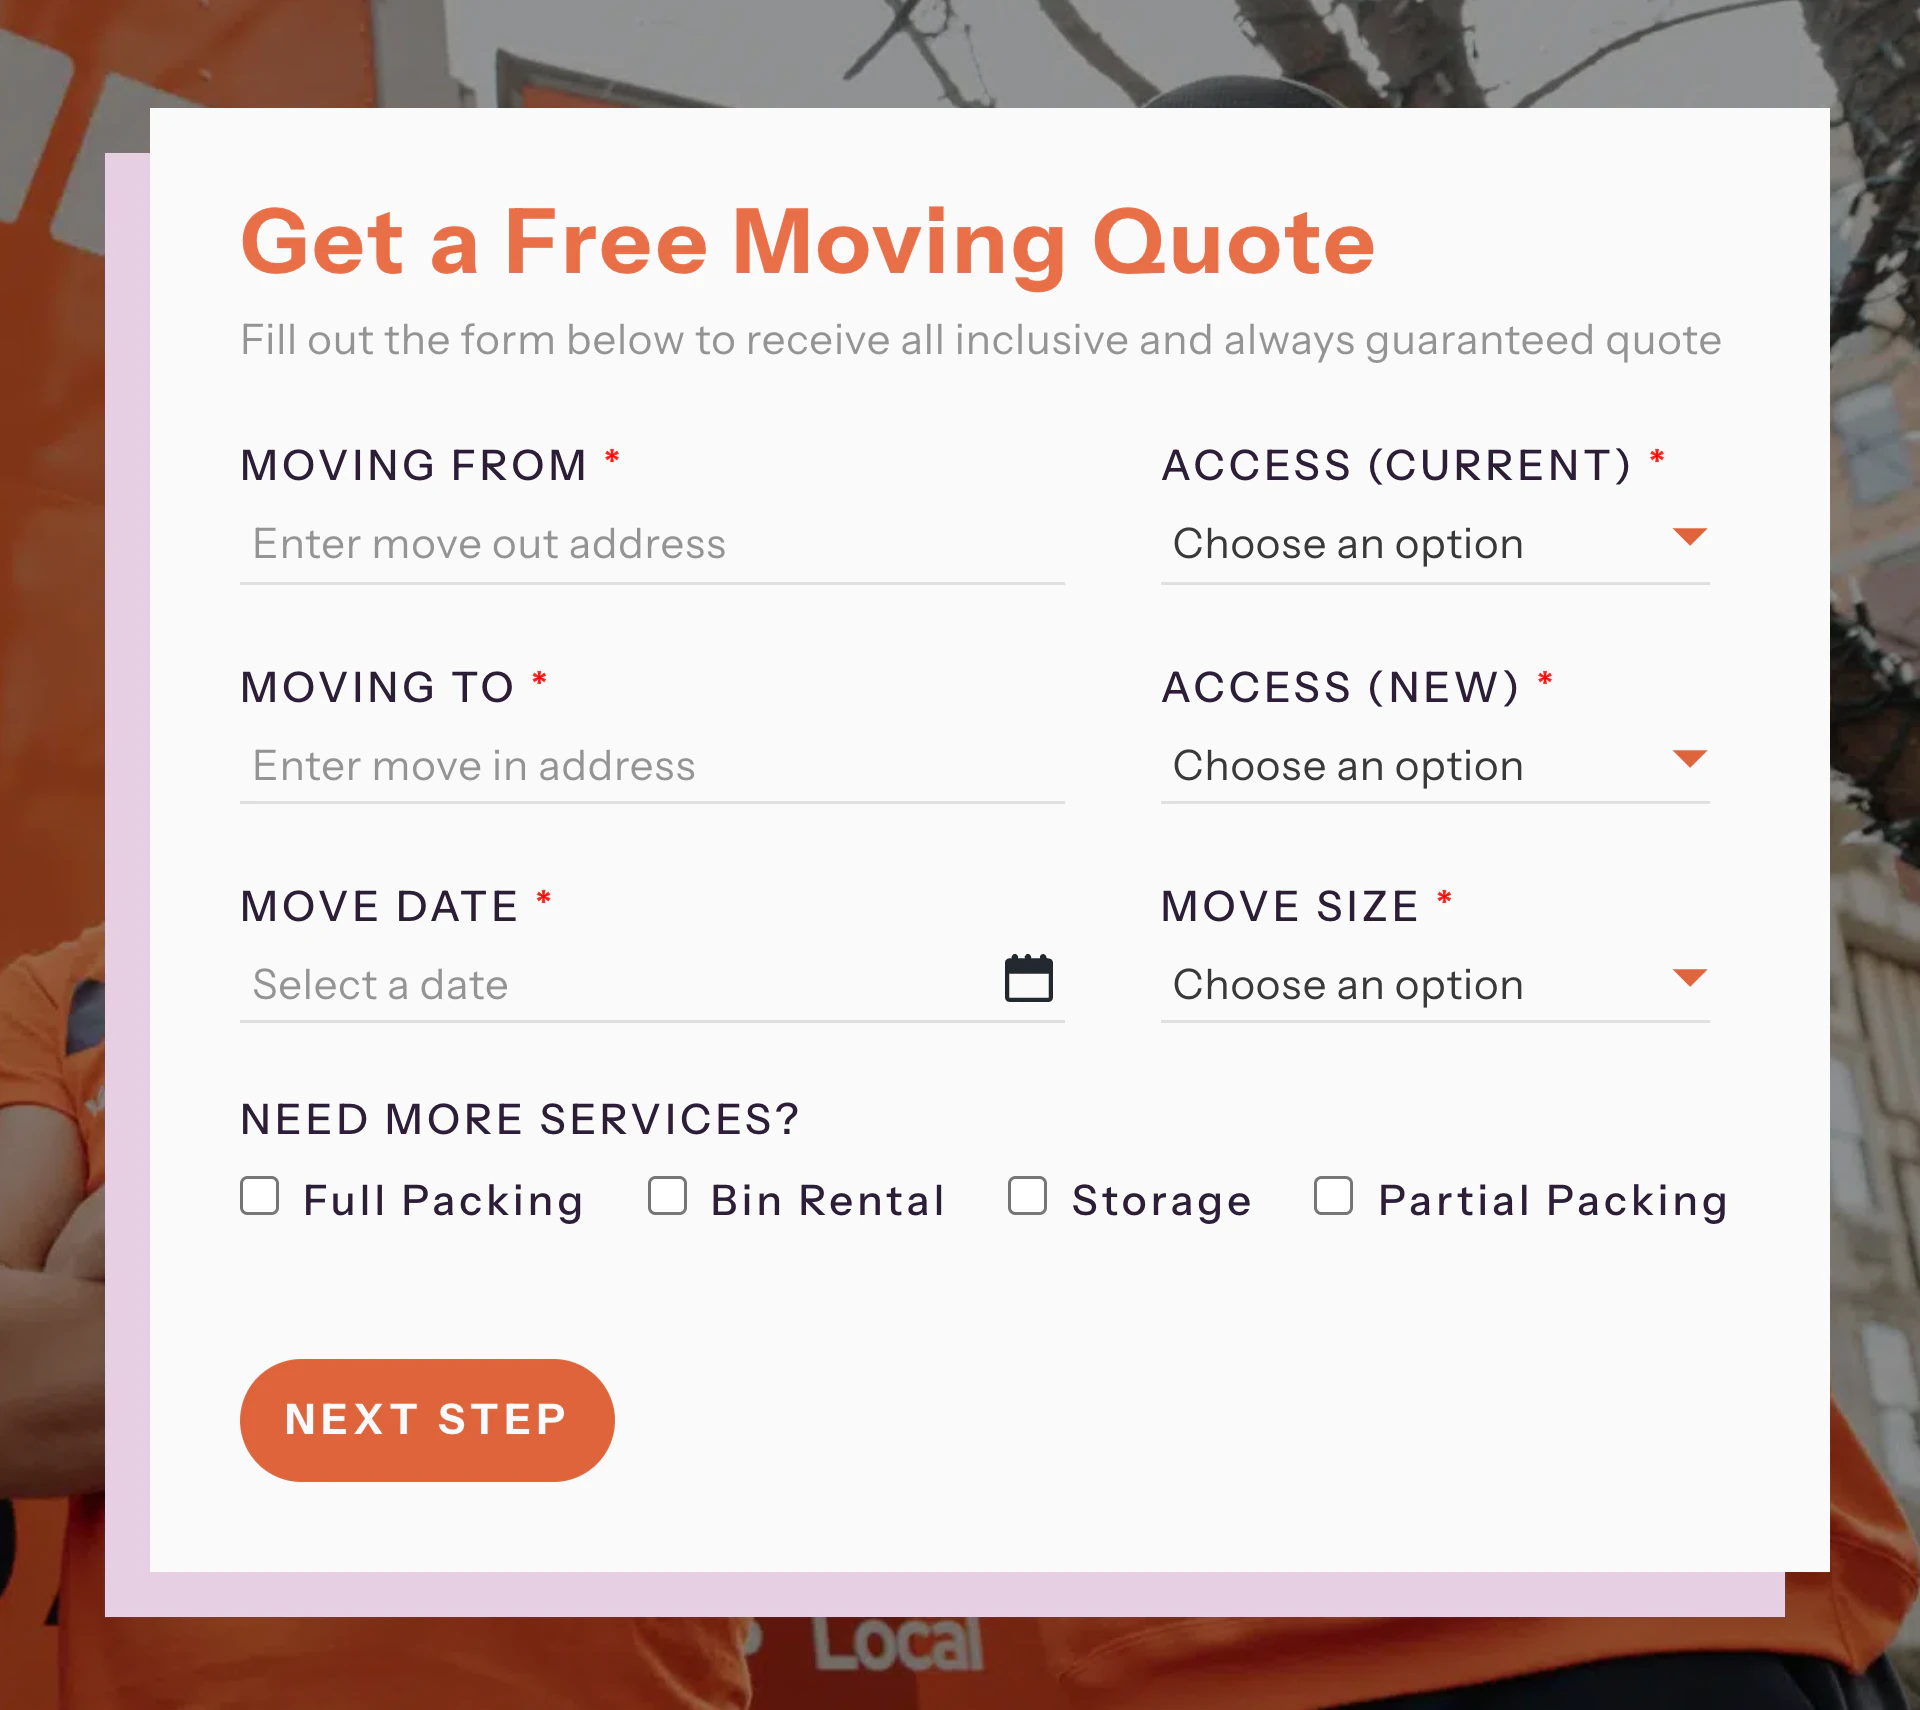
- 01 · The Quote
A real quote, right in the hero.
Address in, all-inclusive price out — move size, access and extras handled in one short form. Customers get a number before a competitor’s page has even loaded.
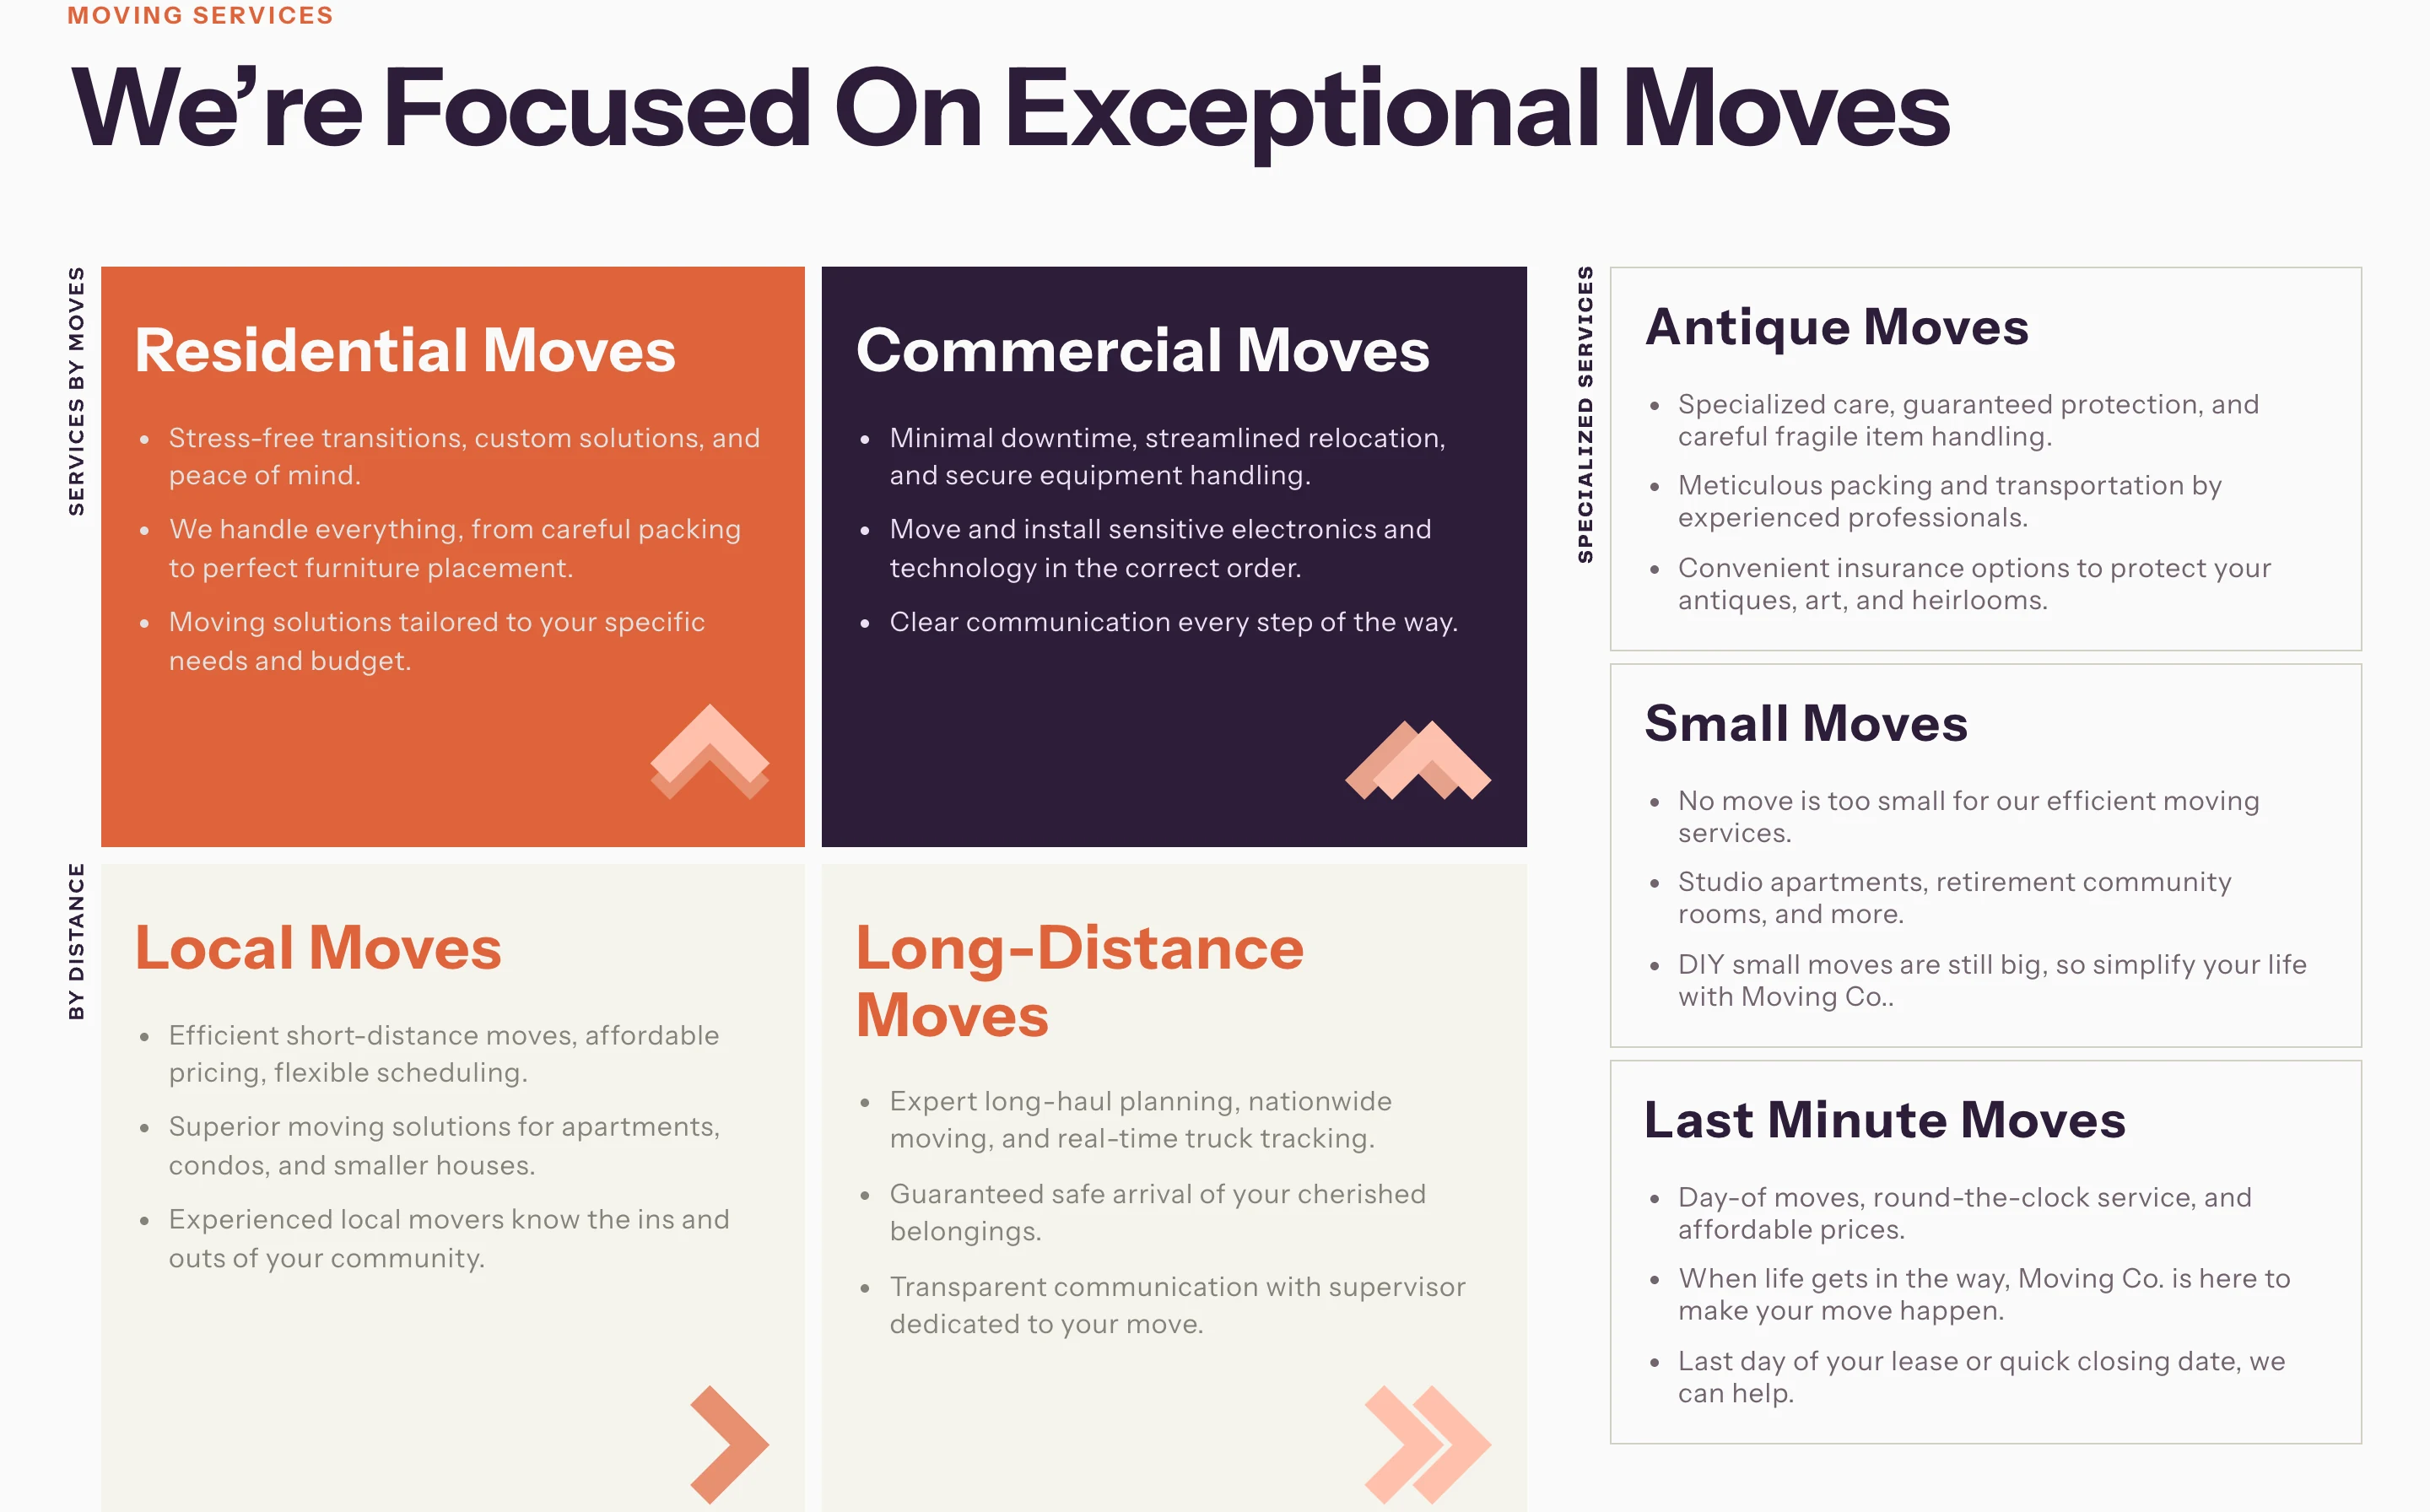
The quote form - 02 · Services
Every move, read at a glance.
Residential, commercial, local and long-distance — plus specialty jobs like piano, antique and last-minute moves. Each one scannable in seconds, so a visitor finds themselves fast.
The services grid - 03 · Coverage
Local roots, coast-to-coast reach.
A live map shows exactly how far the crews go and how fast — same-day across NY, NJ, CT and PA, and long-distance nationwide. No guessing, no “do you cover my area?” call.
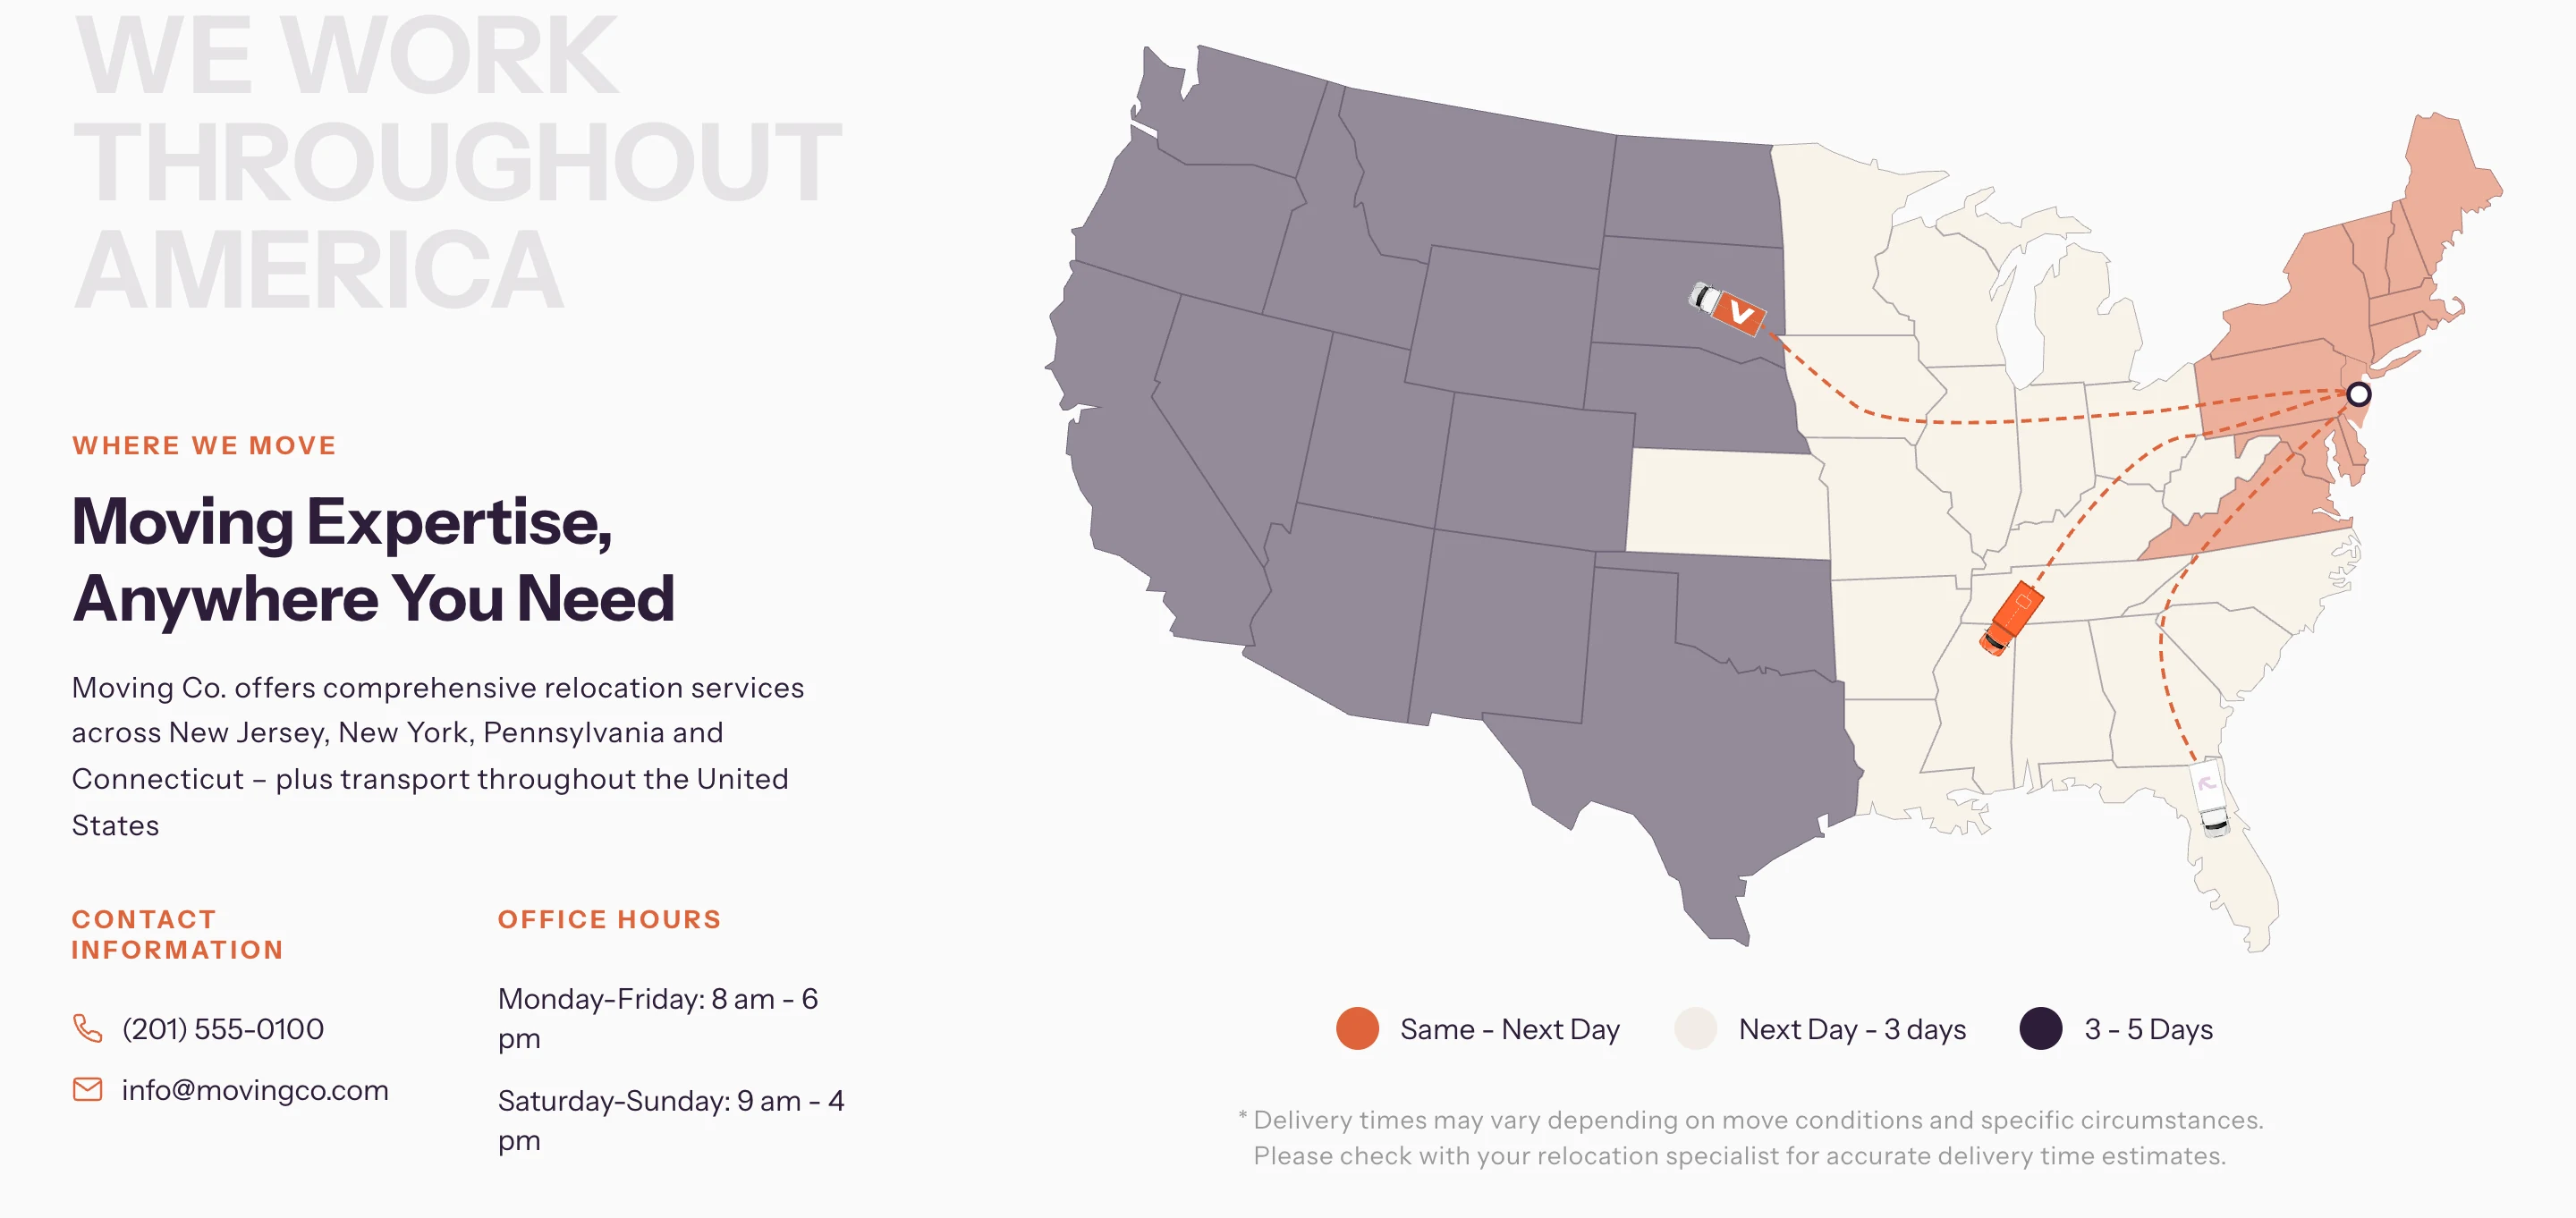
Where they move - 04 · Trust
Proof, built into the page.
Google and Yelp reviews pulled onto the page itself, tagged by the kind of move — the 4.9★ record doing its work where the decision happens.
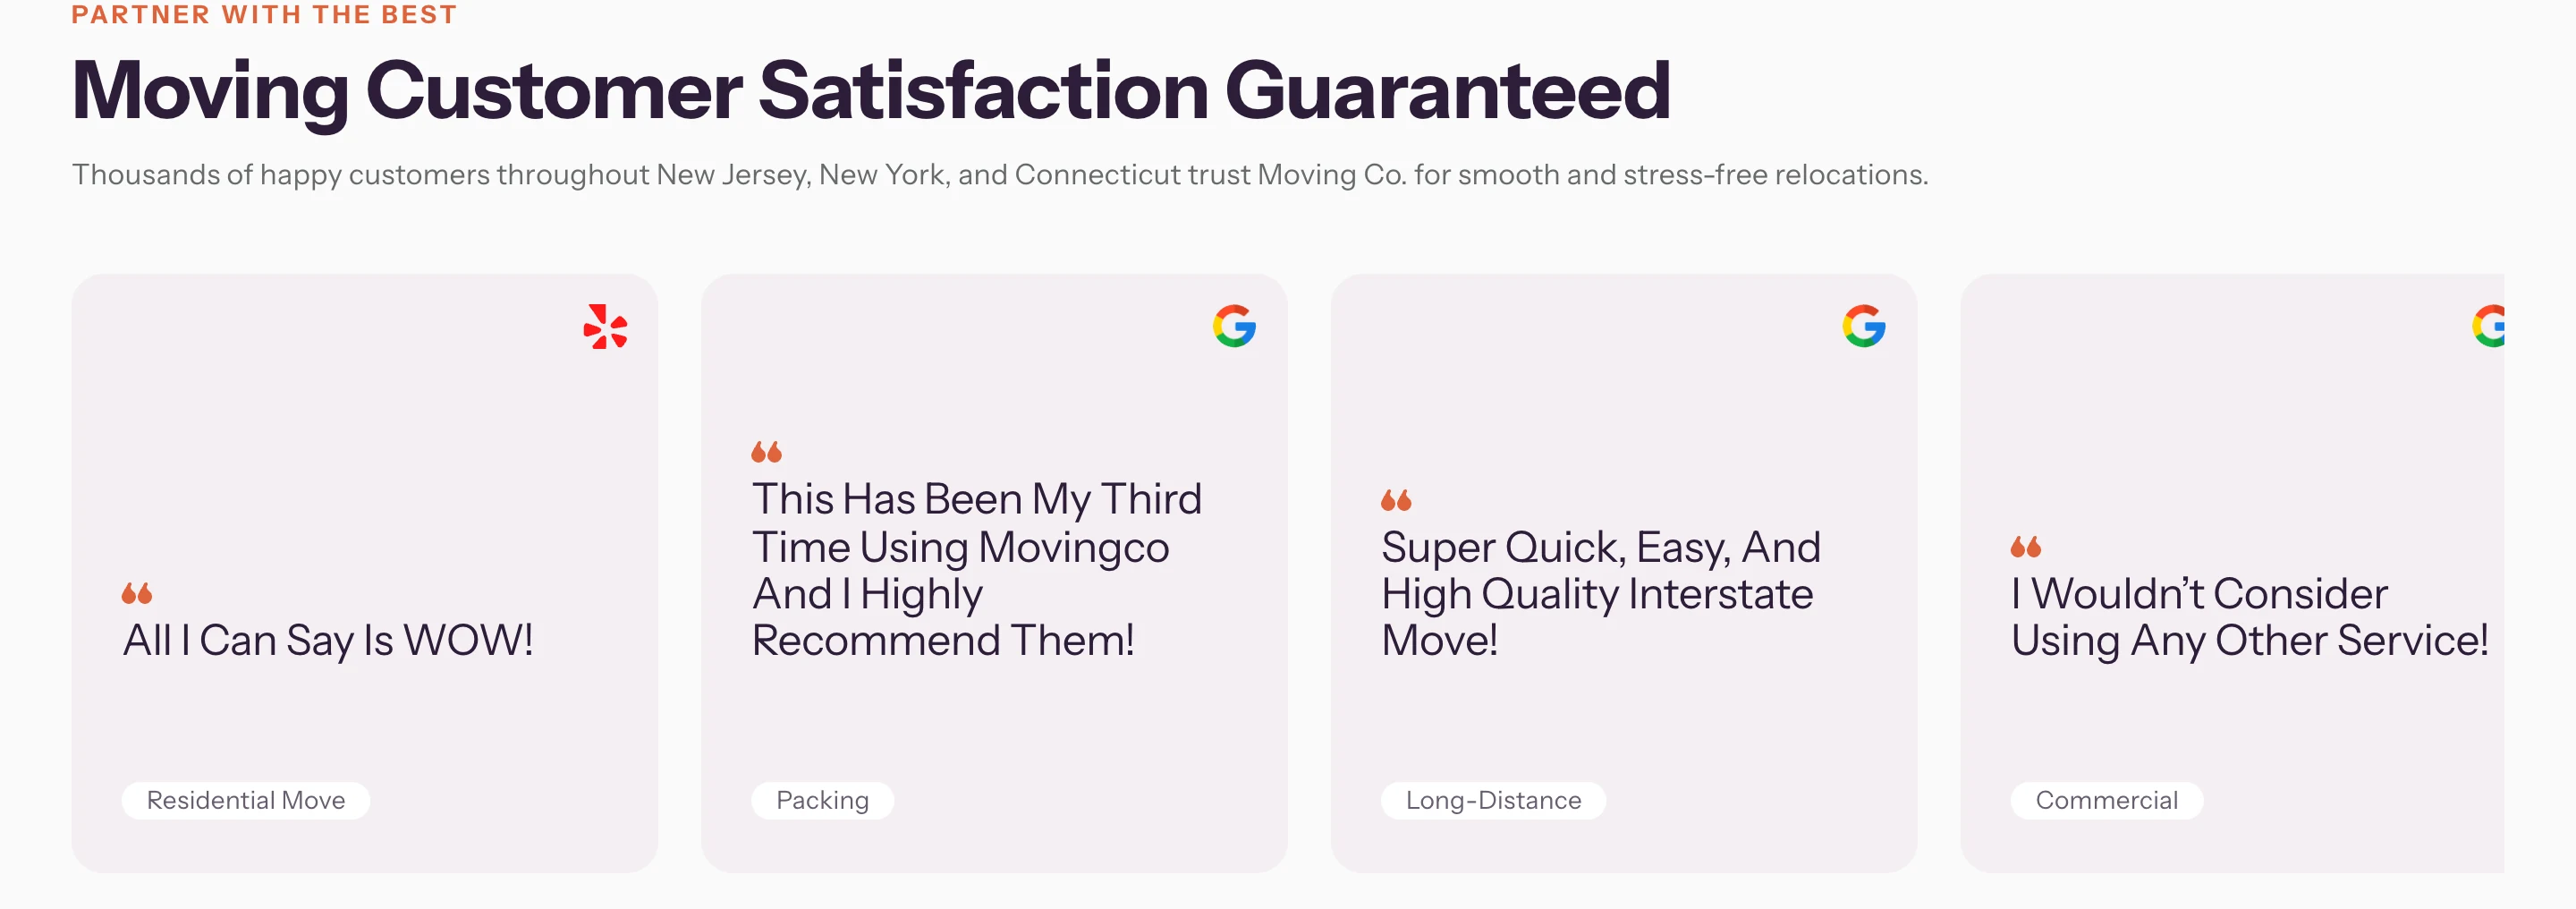
Reviews on the page
The Design System
- Signature Orange
#F15A22 - Charcoal
#211B1A - Cream
#F4EDE2 - Slate
#6B6560
Keep movingforward
- Palette
- Their orange on charcoal, with a warm cream for light surfaces — energetic, confident, unmistakably theirs.
- Type
- A bold condensed display for headlines, a clean grotesk for the rest — loud where it counts, calm where it reads.
- Voice
- Direct and reassuring. It sounds like the crew that actually shows up on moving day.
- System
- A square-cornered card system that scales from a service tile to a full quote flow without breaking rhythm.
One system, not five disconnected tools.
Data flows in, decisions come out — every part wired to the next, so the site stays fast, ranks, and turns visitors into booked moves.
- Instant-quote engine
- Headless CMS
- Local SEO & schema
 The Engine
One Next.js platform — quote, content and tracking in a single place.
- Instant quotes
- Service-area authority
- Booked moves
A platform that books the way the crew moves — fast.
The quote now starts in the hero. Coverage is clear on a live map. And the 4.9★ record earned across thousands of moves shows the moment you land.
- In the hero
Quote, not a phone call
The estimate moved from a call to the first screen.
- 1 form
Address → all-inclusive quote
A clear path from “just looking” to booked.
- 1,856+
Five-star reviews, up front
Proof Google can crawl and rank.
- 4.9★
Review rating, shown on arrival
Google, Yelp and Angi, not buried.
- Coast to coast
Coverage on a live map
Local roots, nationwide reach, at a glance.
- Green
Core Web Vitals
Fast enough to keep movers — and rankings.
It finally moves like the crew that shows up.
Where do you lose the inquiries you already paid for?
How many minutes pass between an inquiry and the first call — and is anyone measuring it? In one call we'll show you where paid inquiries are lost, the real cost per order by channel, and which spend can be switched off without losing revenue.
Want a result like this?
Start with a SCAN Audit — $297, one time. Thirty checks of your public marketing presence, delivered as a 25–30 page PDF within 7 business days of payment. No account access, no call required.